./Monitor -like -a -boss
So recently I set up monitoring around all my systems at home that I could get any data from. This post will cover things like what is Grafana, InfluxDB, and Telegraf, and how can I impliment them. At the same time answer questions like why would I want to do this? and how much resources does it use?
Agenda ![]() :
:
- Grafana.
- Metrics.
- InfluxDB.
- Telegraf.
- How?
- Why?
Grafana
Grafana is simply a software that allows you to bring your own data, or attach a data source to graph that data. It is opensource, completely free to use, and pretty user friendly too! While it does all of that it also allows you to create alerts that can be sent to you in a variety of different ways. I’ve been rollin’ with Grafana now for a little while and I can’t complain much about it. You know that feeling of accomplishment you get when beatting your head around something for a month or two and finally figure it out? Well this isn’t like that. Depending on what you are running it on, it shouldn’t be a hastle at all.
Metrics
Yeah, I’m aware I said above ... graph that data., well this is the crazy part right, you don’t graph data, you graph metrics.
So metrics are a form of data, but when we talk about data we usually think of it as something that doesn’t change, like my name for example, I’m Wesley now and I am 99% sure I’ll be Wesley tomorrow. Metrics are always changing, your CPU isn’t always going to run at 15% utilization correct? Depending on system load your metrics may change which give us graphs that looks like spikes and squigly lines.
When we have a metric that spikes to high for to long we need to act on it, but us as humans, only tend to look at these metrics for a reason. For example I’m not going to spend all my waking hours watching my graphs to make sure my damn memory doesn’t spike. This is what we have alerts for, we set a threshold and when that is breached for a certain amount of time we say “Ayo buddy! Your machine’s memory usage is high!”
InfluxDB
Ahhh InfluxDB… Yeah it’s pretty alright, I mean it’s open source and free to use just like Grafana. But one great thing about this is it’s light weight, and has a out of box data retention setting of 7 days! So this brings us into a sticky situation when we get a ton of systems on a networking sending data constantly to a database. Like for example, where do we store this! So Influx’s 7 day design is great for at home with a smaller environment, however in a large environment you would be saving these metrics on a bunch of replicated servers and keeping it for upwards of a year or two, but at home I only care about a week’s worth of data MAX. So anyway’s what is InfluxDB exactly? Well it’s a Time Series Database! So you have a timestamp associated with a value in a given table. You could have multiple tables like CPU, MEM, DISK, NETWORK, and all of these have a ton of entries of these time/value pairs.
Telegraf
So now we covered graphs, metrics, and storing them. How the hell do we get them from each machine?! So Telegraf is a barebones application it just runs in the background without anyone ever knowing. It’s one of those things you set it loose and it works. Telegraf has hundreds of built in checks written in GoLang to go sift through system stats and grab info on them. You can just turn on a check and it’ll gather all the default metrics from your system ![]() .
So once Telegraf gets the data it sends it to the configured InfluxDB database and authenticates as a specified user.
If you made it this far you are probably going insane, but most of all you probably just realized I explained the whole system backwards.
.
So once Telegraf gets the data it sends it to the configured InfluxDB database and authenticates as a specified user.
If you made it this far you are probably going insane, but most of all you probably just realized I explained the whole system backwards.
![]()
![]() Telegraf
Telegraf ![]() InfluxDB
InfluxDB ![]() Grafana
Grafana ![]()
![]()
Telegraf gets metrics from the computer, sends them to InfluxDB, and Grafana connects to the database and then graphs the metrics.
How and Why?
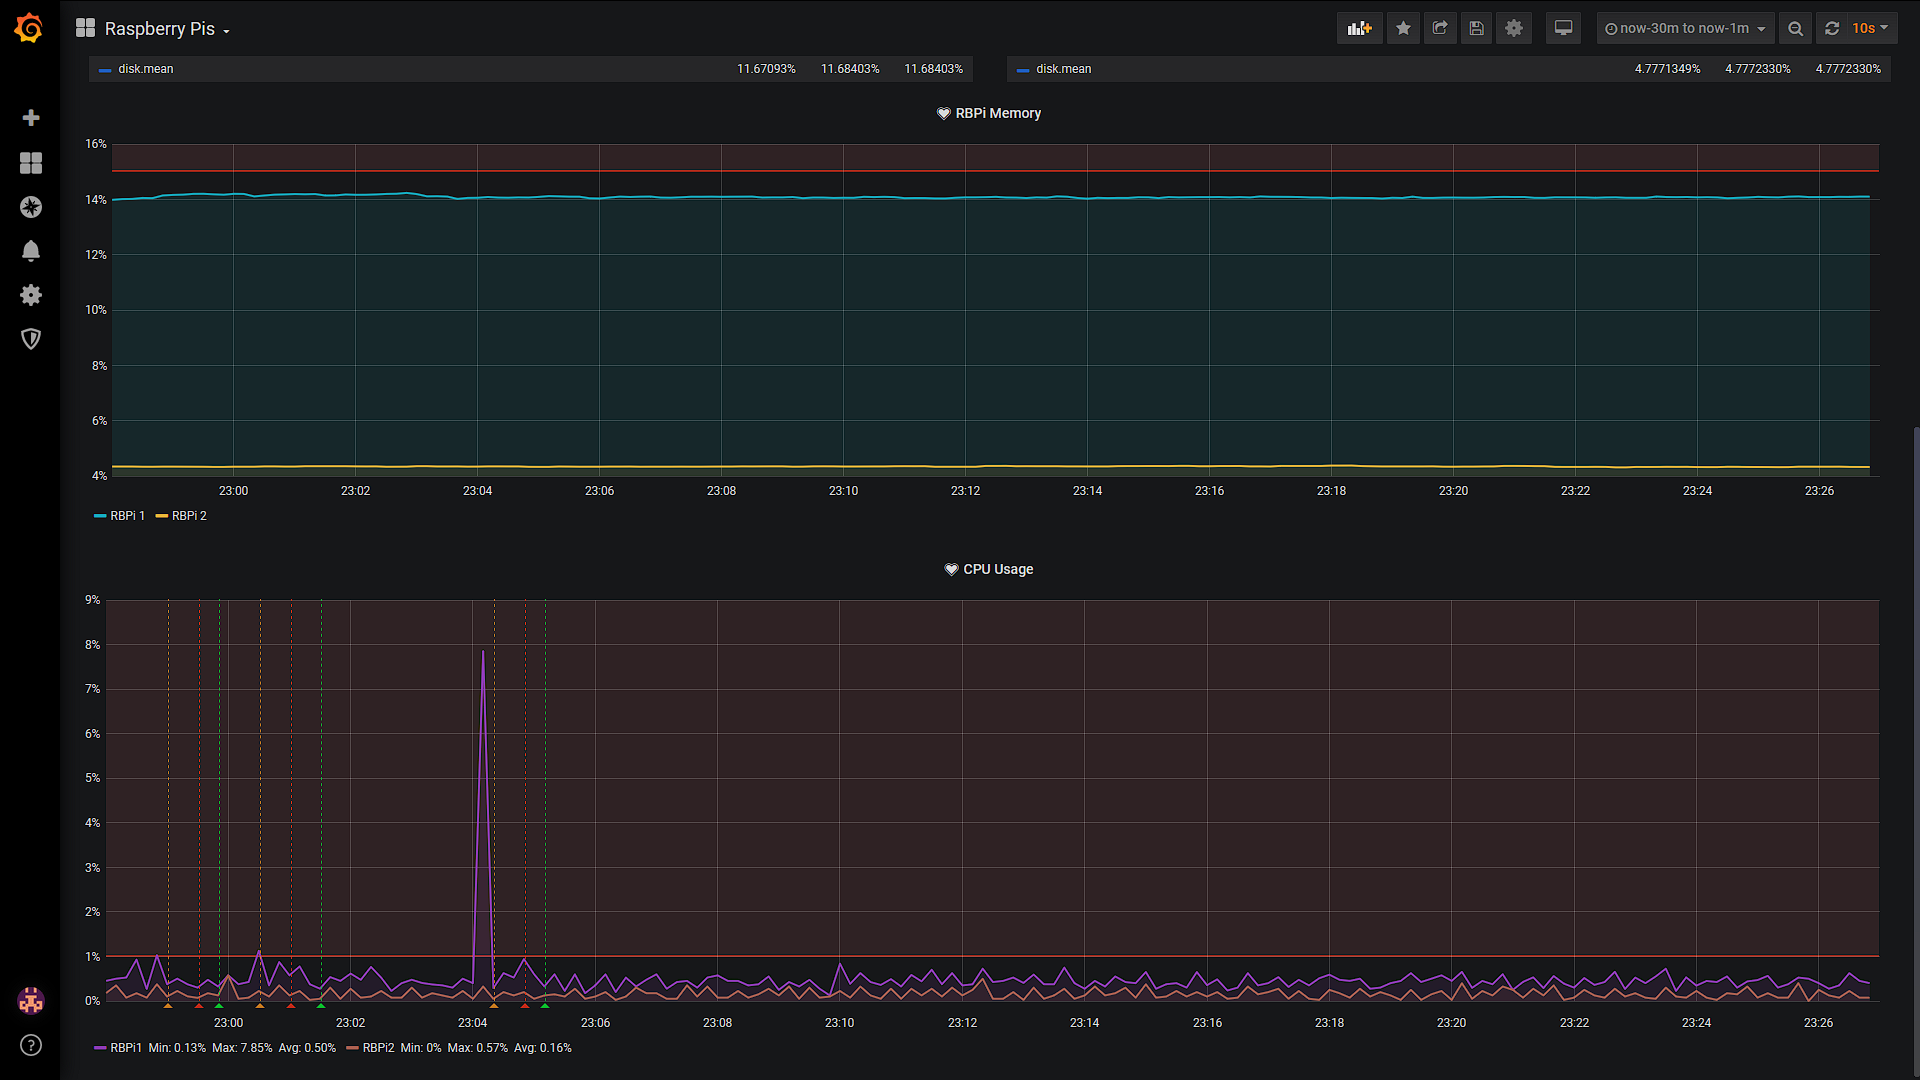
I am comfortably running this whole monitoring system on a singular RaspberryPi and have not faced any issues with doing so. It is a quad core cpu with 2GB of ram, the RaspberryPi runs at about 8 or 9 percent Memory usage with the CPU below 1% utilization, and it is running all 3 programs. Telegraf uses practically no system resources surprisingly. I believe the biggest resource useage is the grafana web frontend. So why would you ever want this? Well when you have a few Raspberry Pi’s, Laptops, and Desktops at home all doing different things, serving different purposes it’s nice to know the health of your systems. While I am not going to cover how to set up a dashboard and set up alerts, they are handy to have.
If you made it this far thank you for tuning in! Let me know what you think below in the comments, the rest of the post is setting it all up. ![]()
![]() This guide assumes you are using a RaspberryPi. It shouldn’t be very hard to port over.
This guide assumes you are using a RaspberryPi. It shouldn’t be very hard to port over.
1) Install Grafana!
sudo apt-get install -y adduser libfontconfig1
wget https://dl.grafana.com/oss/release/grafana_6.7.2_armhf.deb
sudo dpkg -i grafana_6.7.2_armhf.deb
2) Start the Grafana server
sudo systemctl enable grafana-server
sudo systemctl start grafana-server
3) Now lets make sure we have ports 3000 and 8086 open.
telnet 0.0.0.0 8086
telnet 0.0.0.0 3000
4) If these are open great! If they aren’t do the following
sudo iptables -A INPUT -p tcp -m tcp --dport 3000 -j ACCEPT
sudo iptables -A INPUT -p tcp -m tcp --dport 8086 -j ACCEPT
sudo iptables-save
5) Next we neeed to get the IP address of your machine running the Grafana server.
hostname -I
4) Now go to http://
5) Go through everything until it asks to add a data source.
5) Now lets install InfluxDB:
wget https://dl.influxdata.com/influxdb/releases/influxdb_1.7.10_armhf.deb
sudo dpkg -i influxdb_1.7.10_hf.deb
sudo systemctl enable influxdb
sudo systemctl start influxdb
6) How about we create the database and user, First type influx and wait for it to come up with a prompt.
CREATE DATABASE <name>
CREATE USER admin WITH PASSWORD '<password>' WITH ALL PRIVILEGES
7) Now that we got InfluxDB rolling we can set up the Datasource. Go to the Grafana web frontend and then go to add data source and choose “InfluxDB”.
For HTTP url add http://localhost:8086 leave everything else the same. Down at the bottom where it says “InfluxDB Details” fill in the database name, user, password. Save and test.
8) Now we must install telegraf
wget https://dl.influxdata.com/telegraf/releases/telegraf_1.14.0-1_armhf.deb
sudo dpkg -i telegraf_1.14.0-1_armhf.deb
9) Now edit /etc/telegraf/telegraf.conf with vim under the [[outputs.influxdb]] section, replace username and password with yours:
url = "http://localhost:8086"
database = "grafana"
username = "user"
password = "Panther$"
10) Now enable and restart telegraf
sudo systemctl enable telegraf
sudo systemctl start telegraf
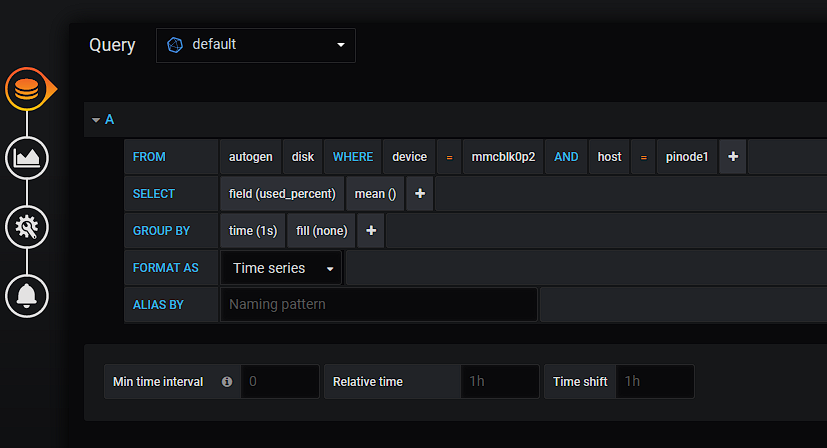
Go to your web ui, create a dashboard, Grafana offers a quick SQL like query that is half filled in for you already, poke around and see what you can make! ./Monitor -like -a -boss !! Create an alert rule on the left under alerting, Create an alert under one of your graphs below the SQL like query, send it to slack and wait patiently for all hello to break loose!
That should be all you need to start creating graphs and dashboards with Grafana, InfluxDB, and Telegraf!
If you are interested in running it on a RedHat system here are the download links the configuration should still be the same!